I already explained in a previous post why I find GitPitch so interesting. In this one, I want to cover some of the basics.
Since version 4, GitPitch introduced a new way to position elements. The developer calls it the GitPitch “Grid System.” It took me a while to wrap my head around it, but once it clicks, it’s an absolute joy to work with.
Dead simple – once it clicks
Let’s start from scratch. In GitPitch, you can define elements and their size. Imagine you want a block on the left side of your slide where you can place an image or some text. In GitPitch, that block is called a “drag.” This tripped me up at first. On its own, the word “drag” didn’t exactly scream “this defines a size” to me – I had very different associations. (If you’ve ever tried naming CSS classes at 2am, you’ll know the feeling of words meaning absolutely nothing anymore.)
To make sense of it, think of the slide as a grid measured in percentages, from 0 to 100. You should stick to percentages so your presentation scales properly across all devices. In our example, we have a box that takes up 50% of the width and 50% of the height of the entire slide.
Now we can position that box anywhere on the slide. Imagine picking up a box of a certain percentage-based size with your hand and placing it – dropping it – onto the playing field (the slide). That’s what “drop” means here.
In short:
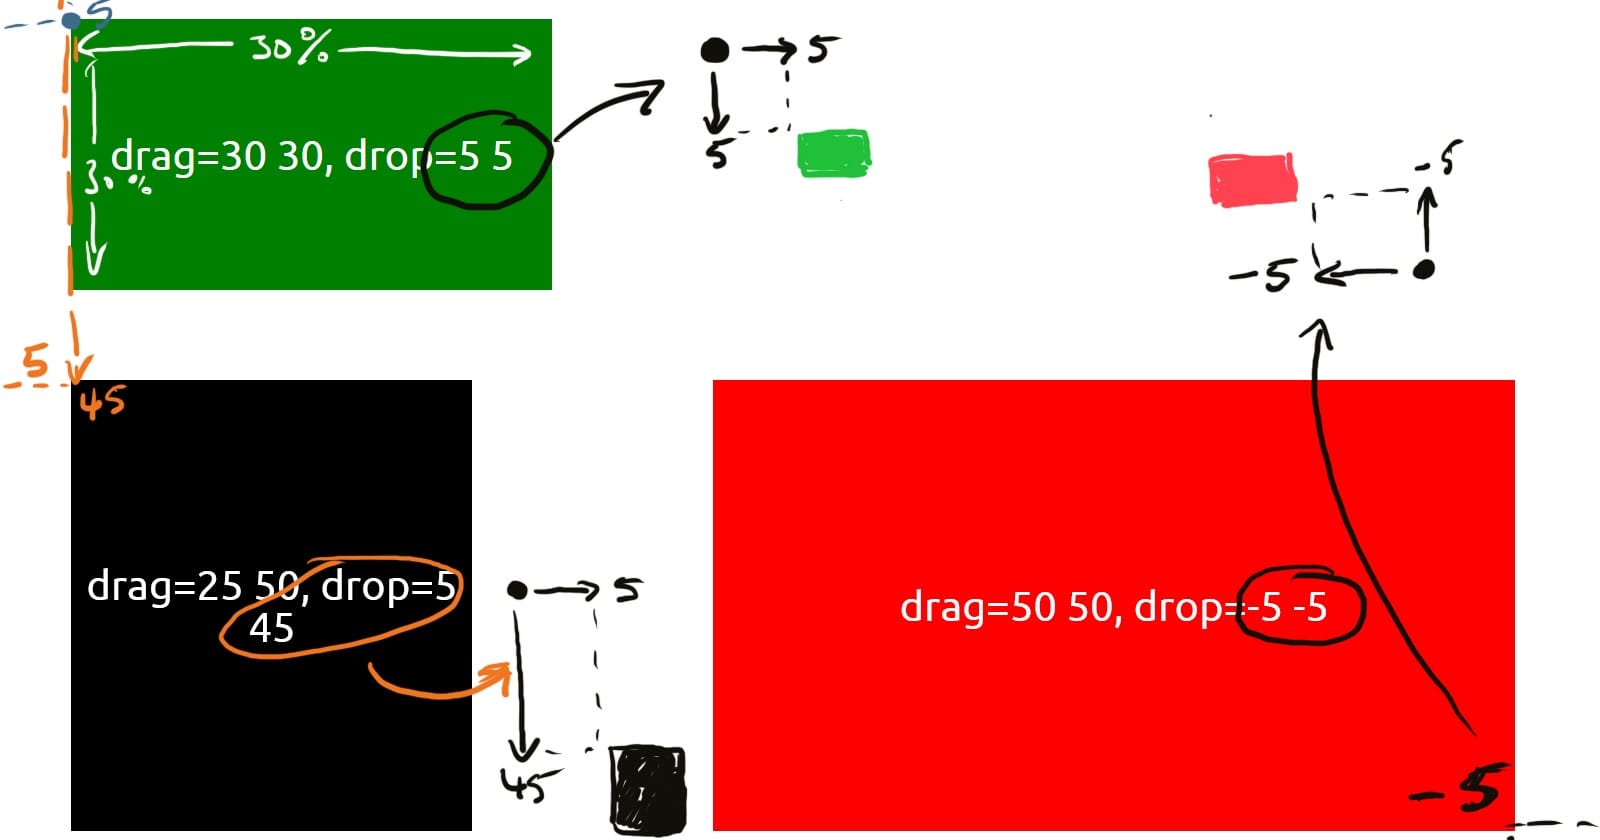
- Drag: The size of the area on the slide (width x height) – in percentages.
- Drop: Where that area gets placed on the slide (also: relative/percentage-based). Counting from the top left: positive values. From the bottom right: negative values.
Here’s a little diagram to make it clearer.
I had some trouble understanding this at first too. As with most things, you need to spend a bit of time with it and then it becomes completely obvious. So I don’t forget it – and so maybe someone else doesn’t have to wade through the same confusion – I’m writing it down here.
For calculating the right values for drag and drop, there are two approaches. One counts from the top left (positive values), the other from the bottom right (negative values). It always refers to the outermost corner of the area.
An example:
[drag=50 50, drop=10 10]
… places a rectangle in the top left with a 10% margin from the top and 10% from the left side.
And this is how I created a red rectangle with white text:
[drag=50 50, drop 10 10, bg=red, set=text-white]
The developer offers a few other interesting placement options, which I’ll either add here or cover in a separate post.
I’ve been planning to publish a small GitPitch series, step by step and at unpredictable intervals. So, stay tuned…
This post first appeared in German on reinergaertner.de, where I’ve been writing since 1997 – back when the internet still had that new-car smell. An AI assistant helped with the translation under my supervision. If something reads a bit odd, blame the Denglish in my head.